As combines are rolling across the nation’s wheat fields, farmers have a lot to think about. In 2020, issues surrounding demand, export competition, stocks, yields and prices (to say nothing of the ongoing COVID-19 pandemic) are all top of mind.
While clarity around these questions is still months away, this article seeks to provide thought-provoking charts and insights related to these issues. We hope you get some downtime, unrelated to breakdowns, in the combine cab and enjoy scrolling through the charts and analysis.
Demand
Wheat consumption in the United States has been mostly flat for several years. The USDA’s June 11th update to the World Ag Supply and Demand Estimates (WASDE) estimated that domestic consumption of wheat in the marketing year 2020/21 would decline about 3 percent from the previous year. There is some debate that increased millings in March, due to high demand for flour products during the pandemic, will continue to carry over into the coming months.
Global demand for wheat continues to increase at a steady pace. The USDA estimates that consumption outside of the U.S. will increase about 1 percent over 2019 levels. This expected increase in global consumption could open additional opportunities for U.S. exports. Through April 2020, U.S. wheat exports are below 2019 but about 3.5 percent above the recent average.
Still, there are a couple of hurdles that U.S. producers must jump to increase their market share of global wheat exports. First, the U.S. dollar has strengthened relative to other currencies. Second, wheat production and stocks are expected to increase in major exporting regions.
Production
Despite the increase in production from other major exporters, U.S. production is expected to decline about 2 percent from the previous year. The decline is a result of both slightly lower total acres planted as well as slightly lower yields.
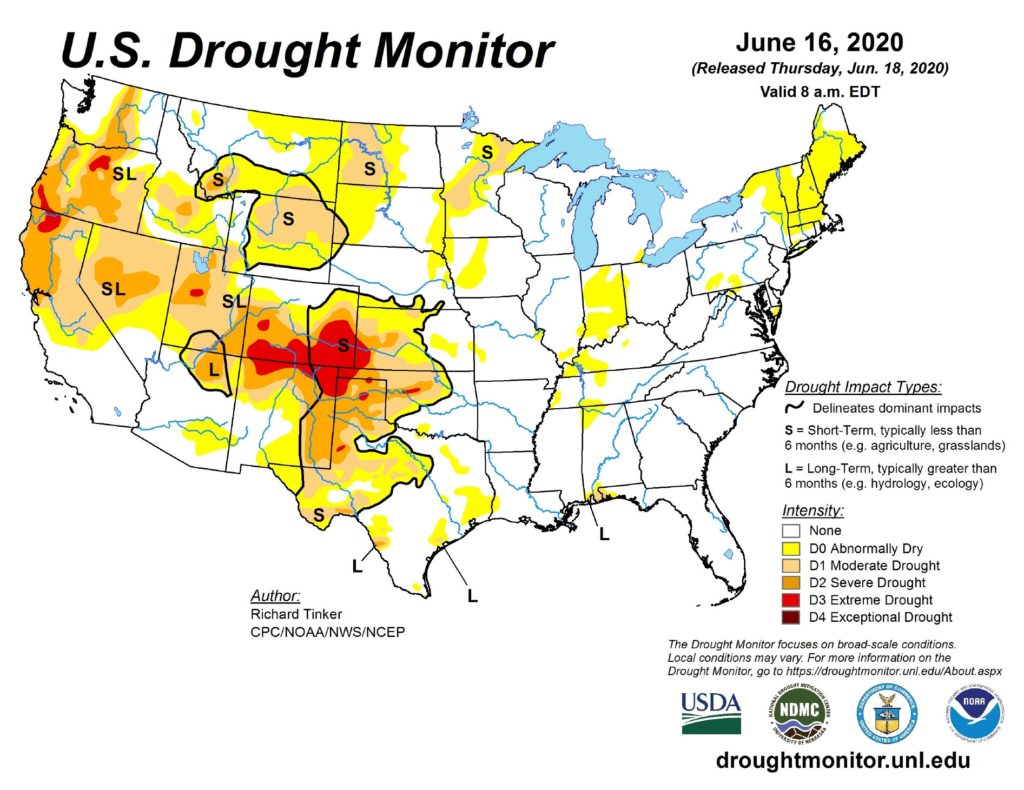
Yields are likely to vary across wheat production acres. Portions of Kansas, Colorado, Oklahoma and Texas have dealt with both frost damage and drought concerns. Final yield estimates for these areas will go a long way towards producer’s bottom line as well as local basis.
Pulling it Together
When pulling together and reviewing the data, a few trends begin to emerge. First, U.S. stocks-to-use ratio is slightly less than the last several years. This lower ratio should provide a modest price bump for most producers. Second, major exporters also have a large amount of wheat available for export, that is to say beginning stocks plus production and imports minus domestic consumption remain high.
Although there are certainly gloomy aspects to the data presented, USDA’s wheat commodity cost estimates, yields and current prices do leave some optimism for profitability in 2020.
LEARN MORE
To learn about financial services tailored for your operation, please visit our contact page or call us today at 800.800.4865.
Disclaimer: This material is for informational purposes only and cannot be relied on to replace your own judgment or that of the professionals you work with in assessing the accuracy or relevance of the information to your own operations. Nothing in this material shall constitute a commitment by American AgCredit to lend money or extend credit. This information is provided independent of any lending, other financing or insurance transaction. This material is a compilation of outside sources and the various authors’ opinions. Assumptions have been made for modeling purposes. American AgCredit does not represent that any such assumptions will reflect future events.


