In 2021, the wine industry began to recover from an unusual and challenging year in 2020. Wine sales sharply improved from the previous year, when pandemic-related restaurant and bar closures spurred a precipitous decline in wineries’ sales at restaurants and tasting rooms.
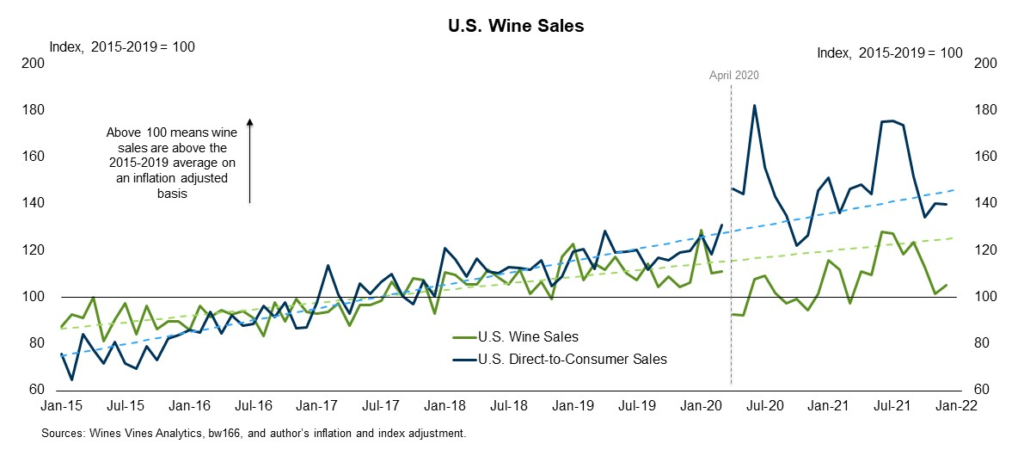
- Wine sales improved around 10 percent in 2021, according to Wines Vines Analytics and bw166, and analysts expect demand for wine to remain healthy in 2022.
- Overall demand for wine grapes has improved, driven by a limited reopening of tourism, restaurant and event traffic.
- Many expect to see modest improvements in wine sales and grape values in 2022. Rising input prices from supply chain disruptions, labor shortages, drought, and general inflation may narrow margins for some operators.
As the economy was reopened in a limited fashion, wine sales began to improve in 2021. At the same time, wineries were able to capitalize on new sales outlets that were forged during the early pandemic era in the United States. Overall demand for wine grapes also improved in 2021. Vineyard values generally remained stable-to-improving, but the cost of developing new vineyard acres increased substantially. Most of the appreciation in costs are due to supply chain disruptions and shortages in materials such as steel, lumber, general construction materials, and the availability of labor and equipment.
Wine sales have bounced back from recent lows. Wines Vines Analytics and bw166 estimate that total U.S. wine sales in 2021 increased about 10 percent from 2020 and were slightly above 2019 sales on an inflation-adjusted basis.
Looking ahead, many in the industry expect that wine sales still have room to grow in 2022. For example, wine sales in 2021 did increase in total dollars, but fell short of the linear trend from 2015 to 2019. The dip below trend could mean that sales continue to grow as pandemic-related restrictions and bottlenecks continue to ease.
Wine Sales Improve in 2021
What led to the rebound in wine sales over the past year? First, direct-to-consumer sales remained elevated as many continued buying directly from preferred wineries. At the onset of the pandemic, wineries redoubled their focus on direct-to-consumer sales. Even as restrictions from the pandemic somewhat eased, these direct sales continued to grow.
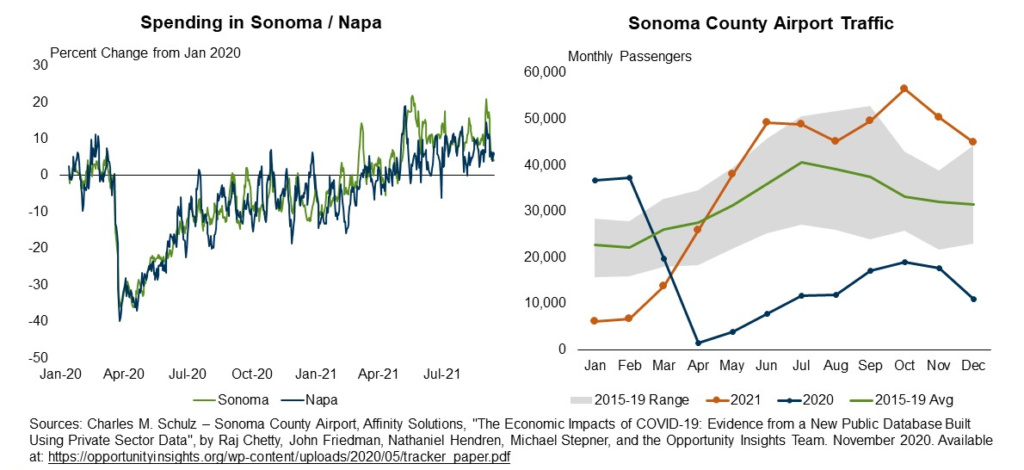
Second, foot traffic and spending at tasting rooms and venues improved in the second half of 2021 as some pandemic-related restrictions began to ease. As a proxy for foot traffic, total spending in Sonoma and Napa counties surpassed pre-pandemic levels around May 2021.
In the same month, airport traffic through the Sonoma County Airport in Santa Rosa also jumped above pre-pandemic averages. Both spending and airport traffic have remained elevated since May 2021. These measures support the anecdotal evidence that wine sales have improved at tasting rooms and similar venues.
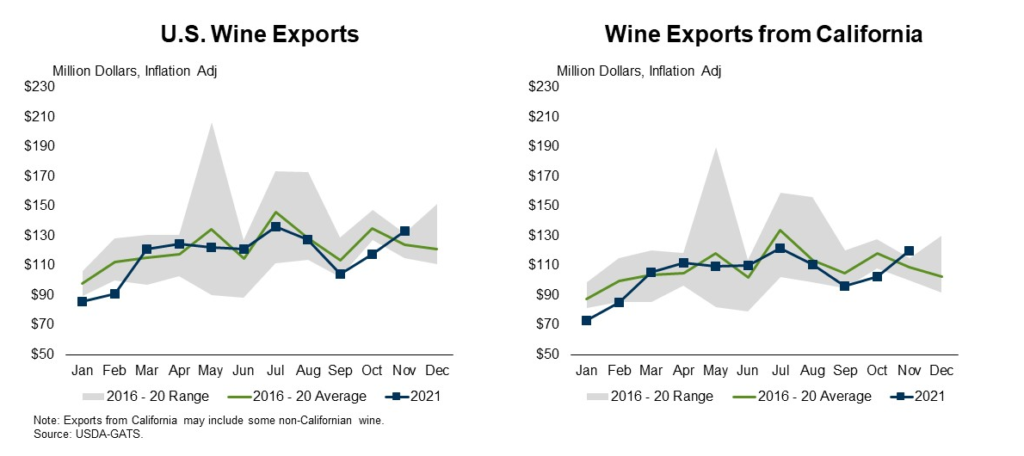
U.S. wine exports also modestly improved in 2021. According to the USDA’s Global Agricultural Trade System, U.S. wine exports through November 2021 increased 12 percent from 2020 levels, and 2 percent from 2019 levels, on an inflation-adjusted basis.
Wine exports from California increased 11 percent from 2020 and 5 percent from 2019. Like total U.S. wine sales, there may be room for exports to grow in 2022 since last year’s exports were below the five-year average.
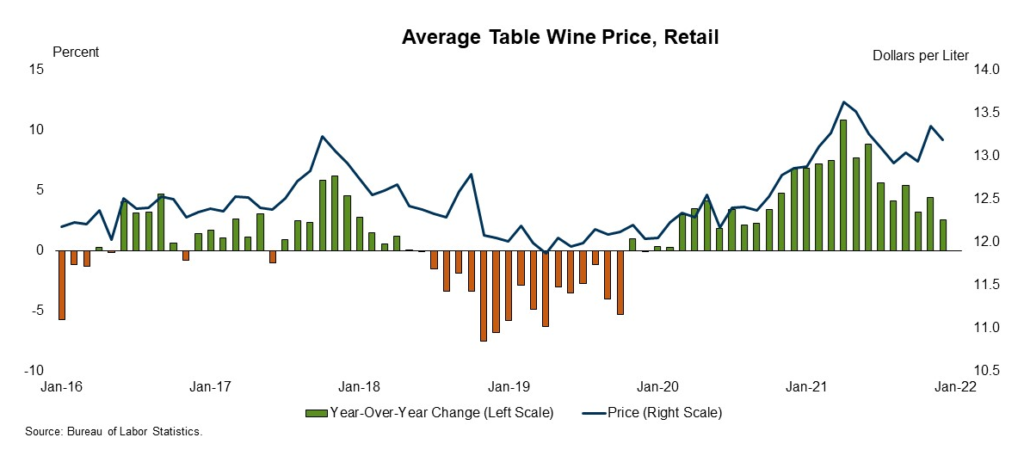
Finally, stronger prices at the retail level helped improve total sales in dollar terms. In fact, table wine prices at the retail level have increased in each of the last 24 months, according to the Bureau of Labor Statistics. Importantly, anecdotal evidence suggests that consumers were willing to pay for the price increase in 2021, which may point to sustained demand heading into 2022. This could also imply that demand for premium priced wine improved, lifting the average retail price.
Rising Contract Prices for Grapes
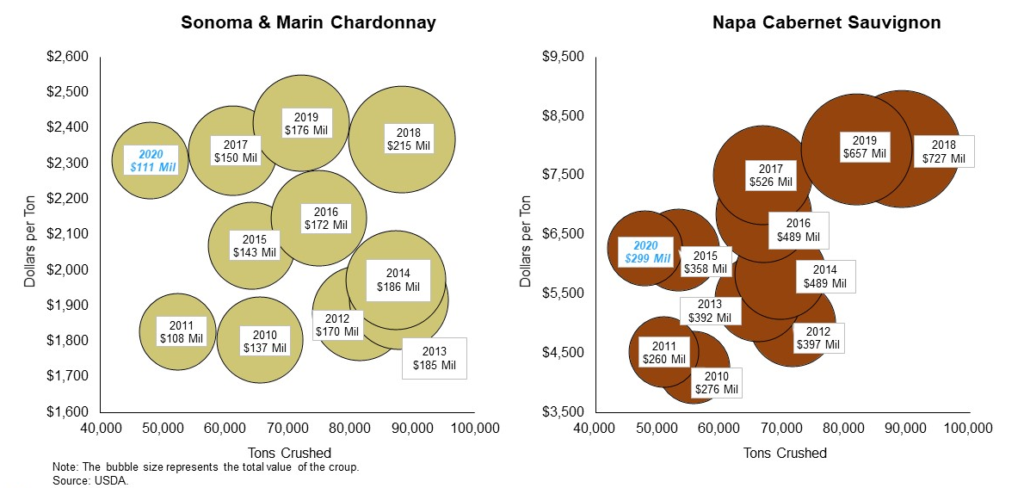
Stronger wine sales in 2021, combined with successive smaller grape crops, have raised the expectation for stronger grape prices in 2022. In February, the USDA will publish a first estimate of 2021 grape prices in the Grape Crush Report. Most in the wine industry expect that the report will show an improvement in average grape prices from 2020 due to both improved wine demand and smaller crops in 2020 and 2021 (see examples below). Many in the industry also expect that grape prices in 2022 will be stronger than 2021 due to improved demand. Some in the industry also expect a smaller grape crop in 2022, due to drought conditions, which may also tighten supply and apply upward pressure on grape prices.
The increased demand for grapes, particularly premium North Coast red varieties, has not yet been realized by wineries and consumers. The 2020 vintage will be released this year and should continue through 2024. Wineries will likely have to rely on 2019, 2021 and 2022 vintages to fulfill this demand, with shortages for certain operators.
While wineries did not have the normal grape and operating expenses in 2020, some operators will be missing the subsequent revenue that is normally received during these release periods. Due to this timing, some of the less capitalized operations may see issues with limited cash to cover expenses.
Wine grape producers have also received positive news on the crop insurance front. The insurance contract price, meaning the price that a winery agrees to pay to a grower for their crop, has increased from two to two-and-a-half times the established price. Also, there is added flexibility to use the weighted average price of contracts.
Vineyard acreage reporting for Oregon and Washington have moved from January 15 to May 15. Contracts for California, Oregon, and Washington are all due by May 15. Finally, a Notice of Damage can be opened at any time during insurance period but must be no later than 60 days from last day of harvest for that variety. Regarding all these changes, please contact your crop insurance agent for clarification and additional details.
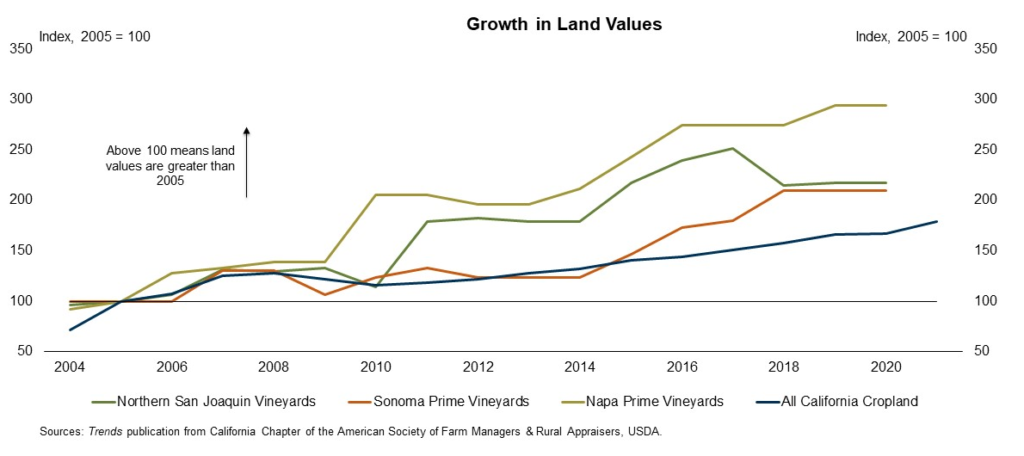
The sentiment around vineyard and winery values mostly improved in 2021. Strengthening grape prices, improved wine sales, and subdued interest rates helped to stabilize, and in some cases improve, valuations that declined during a difficult 2020.
Vineyards values improved in notable AVA locations, including those with good water resources and premium grape production history. Additionally, demand for vineyard and winery properties with supporting facilities or large estate homes with modest vineyard acreages also improved in value. Values for vineyards and wineries in secondary markets, below average production history, or limited water availability softened in 2021. For more in-depth analysis of vineyard valuation, please see the California Trends publication.
Public Health, Inflation and Drought Pose Challenges
While the sentiment about wine sales, grape prices and land values has improved, there are several headwinds that continue to challenge the industry. First, there is significant concern that further variant outbreaks could lead to a reversal in the growth of foot traffic at tasting rooms, event centers and high-end restaurants. Many wineries plan to remain nimble in 2022 while continuing to adapt sales efforts to the environment.
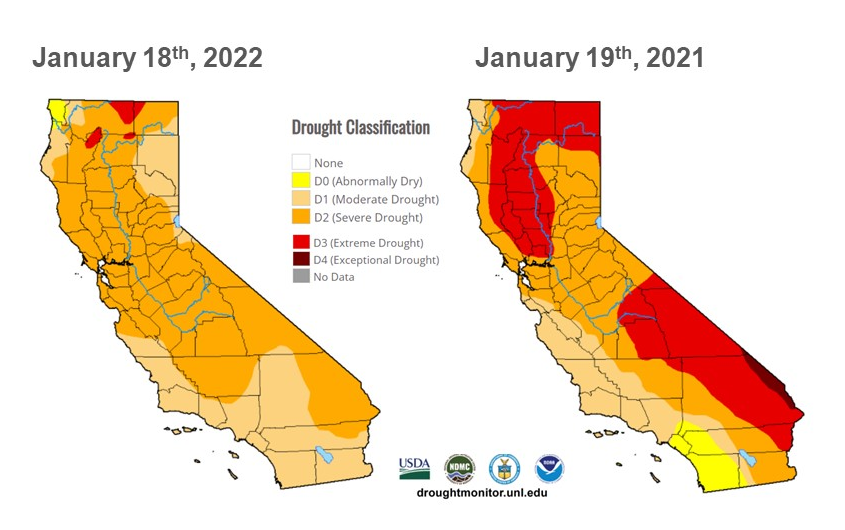
Second, while drought in the western U.S. has been an ongoing issue, California experienced an exceptional drought year in 2021. According to the California Department of Water Resources, last year was the second driest on record for the state. Limited rainfall, decreased snowpack, and more frequent extreme temperatures have contributed to drought conditions for many parts of the state.
Drought conditions have slightly improved at the start of 2022, but precipitation levels remain below normal. Precipitation maps from the, National Resource Conservation Service, which estimate precipitation levels as a percentage difference from the 1991-2020 median, reveal that from a water year-to-date perspective, precipitation levels are 140-160% of normal for the east central region of the state. However, January has been drier than normal and most of the state remains in moderate to severe drought status. Most in the industry expect that the successive years of drought will negatively impact grape yields in 2022.
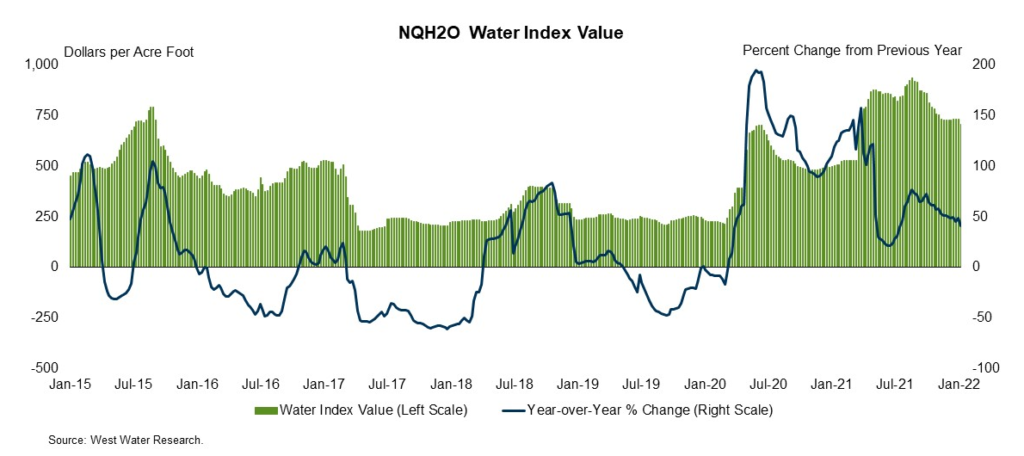
The prolonged drought has also substantially driven up the cost of water. Data from WestWater Research, an economic consulting firm, highlights that the cost of water has significantly increased over the last 18 months, which corresponds to the drought severity in California. The higher cost is more pronounced for vineyards and wineries in drought-stressed areas and for those with limited water rights.
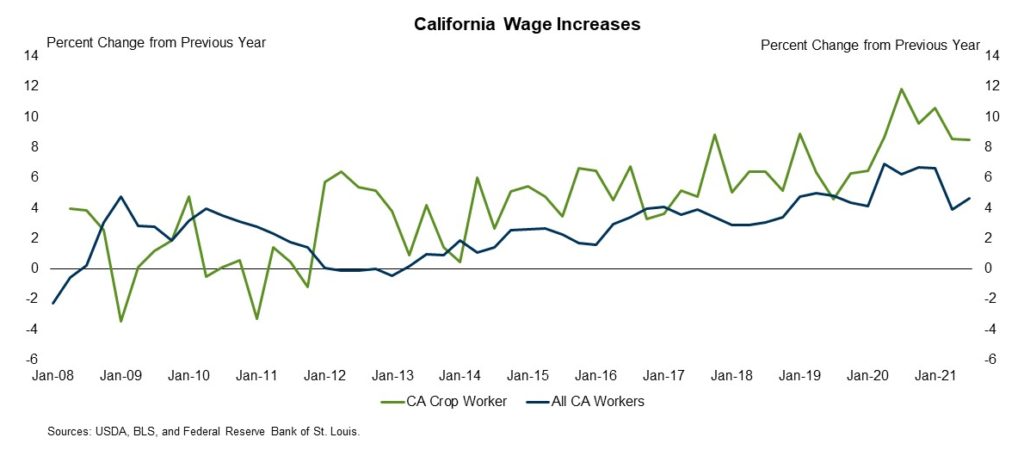
Finally, general input inflation is likely to somewhat trim profit margins. For example, data from the National Agricultural Statistics Service indicates that the average wage for crop workers has steadily increased following the Great Recession. Over the last several years, wages have sharply increased to keep up with the general increase in California wages. In addition to wages, the cost of barrels, glass, steel posts, fertilizers and other common inputs have followed the general upward inflation trend.
Concluding Thoughts on the Industry
As the pandemic stretches into another year, the U.S. wine industry has improved its footing with increased direct-to-consumer sales and stronger overall sales in 2021. Meanwhile, wine business operators are keeping an eye on public health challenges, inflation, and drought as they head into 2022.
Many wine operators have seen vineyard values remain stable, or even improve in some areas, over the last year as contract prices have improved from recent lows. Wineries are approaching 2022 with an eye for new opportunities as well as a blend of in-person and virtual experiences to engage with consumers, which may help offset losses from restaurant closures. As more of the economy reopens, most analysts expect sales to improve as the industry continues its rebound from 2020.
LEARN MORE
We are proud to be a trusted financial partner to the wine industry, with personalized solutions and expertise to help your business grow. To learn more, please visit our contact page or call us today at 800.800.4865.
Disclaimer: This material is for informational purposes only and cannot be relied on to replace your own judgment or that of the professionals you work with in assessing the accuracy or relevance of the information to your own operations. Nothing in this material shall constitute a commitment by American AgCredit to lend money or extend credit. This information is provided independent of any lending, other financing or insurance transaction. This material is a compilation of outside sources and the various authors’ opinions. Assumptions have been made for modeling purposes. American AgCredit does not represent that any such assumptions will reflect future events.

